Different GHGs (greenhouse gases) have different effects on climate warming, known as radiative efficiency or radiative forcing. GWP stands for global warming potential and measures the average forcing over time rather than at any point in time.
Methane, which is the main GHG produced by the agricultural sector, is short-lived because it breaks down in about 12 years. It may also be described as a ‘flow gas’ being destroyed at a similar rate to its emission and only causing warming for that 12-year period. CO2 and N2O area ‘stock gas’, lasting in the atmosphere for hundreds of years.
This difference presents a challenge in terms of accurately accounting for these gases. This article explains these differences and possible solutions.
The issue with methane
UK agriculture accounts for 49% of methane nationally and as other sectors of the economy reduce emissions, this proportion could increase.
Although methane is a short-lived gas, it is a potent greenhouse gas while in the atmosphere. Together with emissions from other sectors such as energy and waste, methane is estimated to have caused 30% of total warming since the Industrial Revolution.
How CO2 and methane (CH4) affect warming
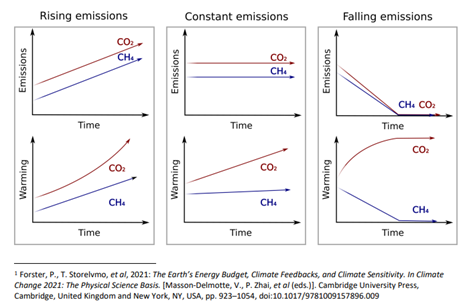
The graphic below illustrates the correlation between emissions of CO2 and methane and the corresponding impact on global temperatures. The main difference is that constant emissions of CH4 have a minimal warming impact when compared to CO2, while falling global CH4 emissions can even contribute to cooling.
Importantly, this only considers additional warming from new emissions. Past emissions also contribute to warming.
University of Oxford – Climate metrics for ruminant livestock
Accounting for methane
The UNFCCC (United Nations Framework Convention on Climate Change) has adopted GWP100 for international accounting purposes under the Paris Agreement and mandates the use of IPCC (Intergovernmental Panel on Climate Change) 2006 Guidelines.
GWP100 is a way of scaling the impact of different GHGs as CO2 equivalents, with different factors assigned for different gases based on a 100-year period. You will see GHG emissions measured in units of MtCO2e – metric tonnes of all GHG emissions expressed as carbon dioxide equivalents. This allows consistency and comparability across nations over time.
This consistency comes with trade-offs and the use of GWP100 is subject to debate. A group of scientists argues that it fails to accurately reflect the warming potential of short-lived gases. GWP100 overstates the impact of constant methane emissions by a factor of 3 to 4x and conversely understates the impact of new emissions by a factor of 4 to 5x.
Alternative metrics
GWP* was the first of several ‘warming-based’ metrics which attempt to address this. It measures the rate of change in emissions to more accurately reflect methane as a short-lived ‘flow’ gas. The policy implications of GWP* are subject to intense debate.
One of the main criticisms of GWP* revolves around international equity as it penalises countries with relatively small but expanding livestock herds. This is also a potential issue for any farms in the UK that expand their business. The focus on additional warming, explained in more detail below, has also been criticised. Read: biogenicmethane.org | Open Letter to Prime Minister Luxon regarding the government’s review of New Zealand’s biogenic methane target
GWP* has not yet been formally adopted by international climate scientists, but it was suggested by the IPCC in 2021 that policymakers should use the GHG metric they think is best. The IPCC states: “The choice of metric and time horizon can affect the distribution of costs and the timing of abatement between countries”.
In the meantime, there have been several revisions to GWP* (GWP*c and GWP* avoidable near-term warming), as well as new warming-based metrics such as Sum44. These directly address some of these issues while still focusing on more accurate representation of methane emissions.
Actual vs. additional warming
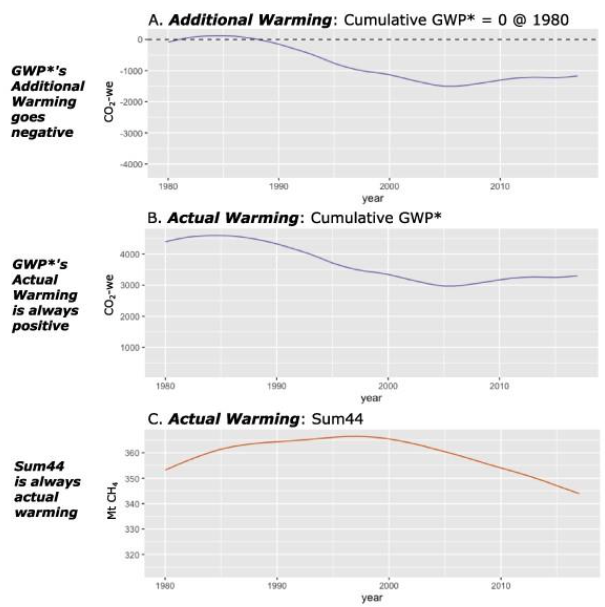
There are two ways of thinking about warming – actual warming and additional warming.
In the additional warming example in panel A, a baseline of 0 is established in 1980 based on the methane concentration in the atmosphere at that time. If that threshold is not crossed, it can be said there is no additional warming and potentially even net cooling.
However, the actual warming, shown in panel B, remains positive. Since methane emissions contribute 0.51C of current warming (2010-2019), ‘no additional warming’ can be misleading from a policy perspective.
By contrast, a metric such as Sum44 that measures actual warming cannot take on a negative value as long as there are net emissions in the 44-year window. It is always measuring actual warming regardless of application.
IOP Science | Environmental Research Letters
Split-gas
Both GWP100 and GWP* are based on conversions of methane to CO2 (mass and warming equivalents, respectively). An alternative approach is to account for long-lived and short-lived gases separately. This is different from the NFU’s dual reporting position, which calls for reporting using both GWP100 and a warming-based metric.
Split-gas would allow for nuanced policy approaches for methane. The prime example of this is New Zealand, where the government has excluded agriculture from its net zero target and instead has set a separate target for biogenic methane. When combined with a warming-based metric, a split gas approach can result in more accurate prediction of warming and therefore more effective policy.
There are several potential drawbacks of adopting a split-gas approach.
- Split-gas could make it more difficult to offset methane emissions with land based sequestration.. Under a single basket approach where all GHGs are combined, it is possible for CO2 sequestration to offset methane emissions. If CO2 and methane are accounted for separately, this would be difficult without a conversion mechanism, which would go against the aim of avoiding the usage of GWP100. This does not mean that sequestration would not be accounted for at all, rather that it will offset only CO2 emissions on farm.
- Split-gas reporting could be accompanied by an emissions reduction target for methane. The feasibility of any such target will depend on specific policy incentives and implementation. However, it should be noted that there is already a commitment to net zero in the UK and any additional methane targets will likely be set at a lower level as was the case in New Zealand.
The NFU believes that owing to its improved accuracy and transparency, split-gas reporting should be adopted nationally and internationally. Over time, this will drive policy shifts and lead to a more accurate reflection of agriculture’s impact on warming. Our policy position has been updated to reflect this.
Emissions reduction remains vital
Adoption of alternative metrics and split gas is important to reflect methane emissions more accurately but this needs to occur alongside continued emissions reductions to ensure the long term resilience of the agricultural industry in the UK.
What the livestock sector needs
CH4 is not the whole story; other environmental impacts should be taken into account such as nutritional value, ammonia emissions, water quality, biodiversity, habitats, and animal welfare. Consumers need balanced messaging not only through a more accurate picture of temperature impacts from livestock farming, but also on all of the above co-benefits.


